The UK government publishes lots of spending data now. Let's do cool stuff!
ScraperWiki is one of these new-fangled cloud services, hosting code that scrapes websites. You can throw some python (or ruby, or php) together to download all the CSV files for a department.
Google Refine is like a spreadsheet on crack, with features ideal for cleaning up messy data sets. I saw it for the first time at OpenTech 2011 a few weeks ago in London. You can take the government data, clean up the worst typos, and integrate it into the scraperwiki scraper.
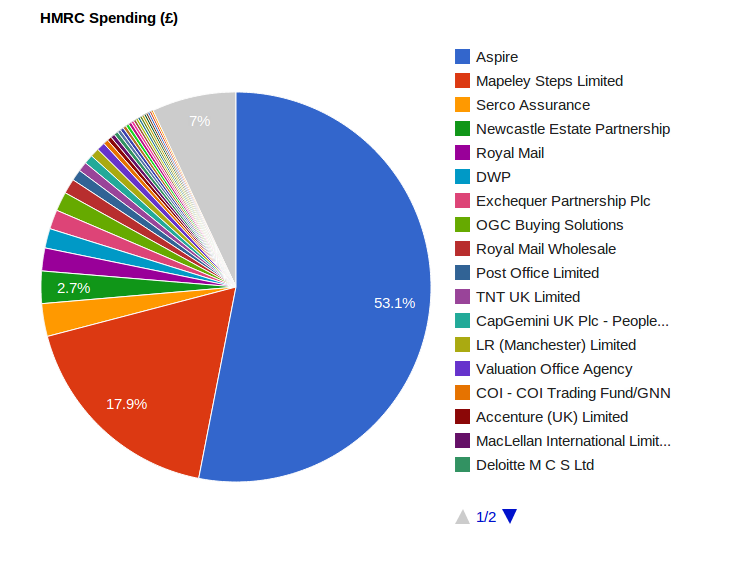
For bonus marks, throw in a bit of jQuery and Google Charts, and create a dynamically generated pie chart, or maybe a word cloud. There must be more imaginative ways to visualize this... email me if you have any ideas!
They interviewed me last week - I must say, that's the first time that's happened, but I'm very flattered. None of the above would exist without the work done by @DataMinerUK et. al., so thank you, everyone.